Projects

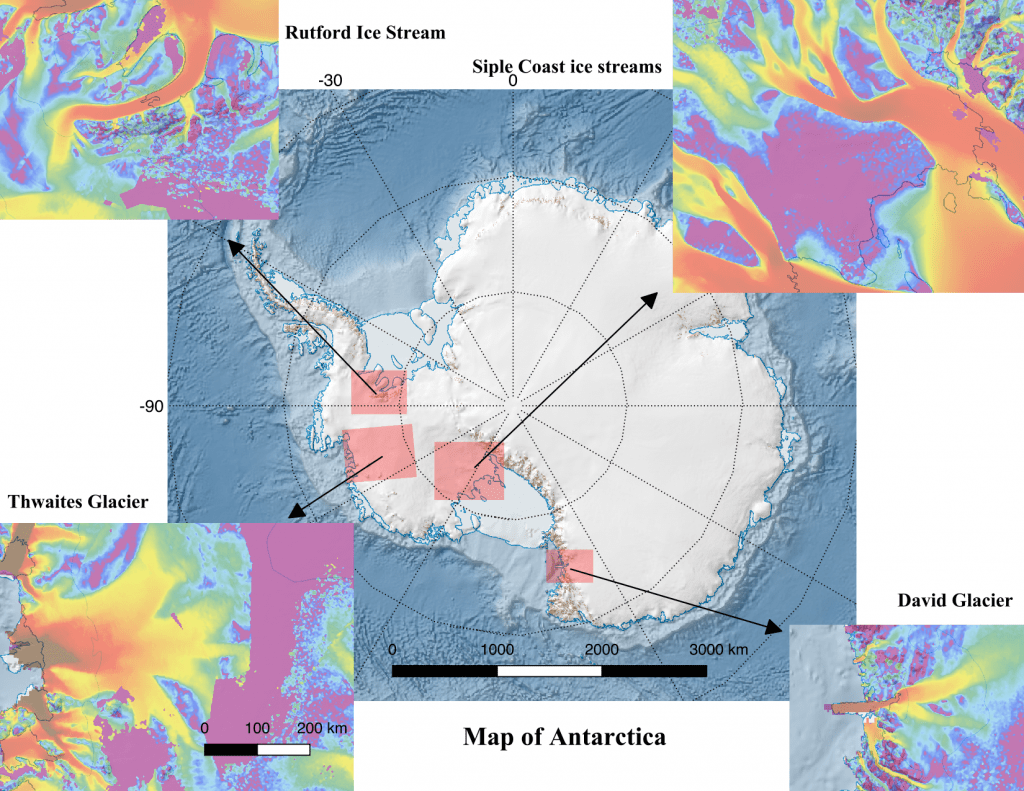
Antarctica map showing locations of Thwaites and David glacier as well as Rutford and Sipple coast ice streams
The highlighted boxes are shown with ice flow speed in color. The purple colors show areas where the flow of the ice is less than 3 m/yr. The yellow colors show regions where the flow speed is 60 m/yr, and the red colors are for areas with speeds of 300 m/yr. The brown colors are for areas with speeds greater than 1000 m/yr.

This map was made with QGIS and the Quantarctica package, which includes many scientific datasets for Antarctica including ice flow speeds, topography, and outlines. The scale for the basemap (3000 km) is on the basemap itself, and the scale for the four inset maps is the same (200 km) and is shown on the bottom left (Thwaites Glacier inset).